Key performance indicators
FINMARI has a set of Key Performance Indicators for following the success of its development and operations, enabling evidence-based decision-making, and aiding in the development of future strategies. The KPI setting is based on the strategic targets of FINMARI.
In methodology, we have followed the logic of RI-PATHS to “sphere of control” (resources, activity, and outputs) Key Performance Indicators, and “sphere of influence” (short-term, and long-term impact as Key Impact Indicators KII. Relevant KPIs and RACER criteria were used according to the Report of the ESFRI working Group, and other RIs (LifeWatch, EMBRC, ICOS, EIROOS and POSEIDON) were benchmarked in setting KPIs for FINMARI.
A new set of KPI´s is set and followed as of 1.1.2025.
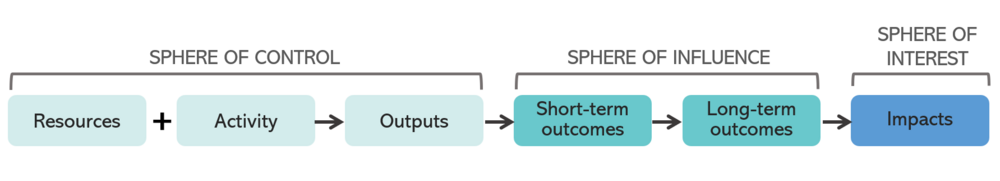
The logic of setting FINMARI Key Performance Indicators. Redrawn from RI-Paths (2020).
The rationale, metrics, monitoring frequency, detailed methodology, synergies and estimated workload of data collecting for the KPI have been discussed and followed by the Management Group, the Board and the Scientific Advisory Board of FINMARI.
The KPIs are scrutinized periodically, updated if needed, and targets are set for the following period. Impact indicators are more complicated to follow because the impacts of an infrastructure are further ‘downstream’ from the actual control of FINMARI. We are monitoring publications, besides direct scientific output, more generally influential publications such as modelling papers, review articles, status assessments and policy papers, which are based on data and information produced in FINMARI. Dialogue with the stakeholder community is also important.
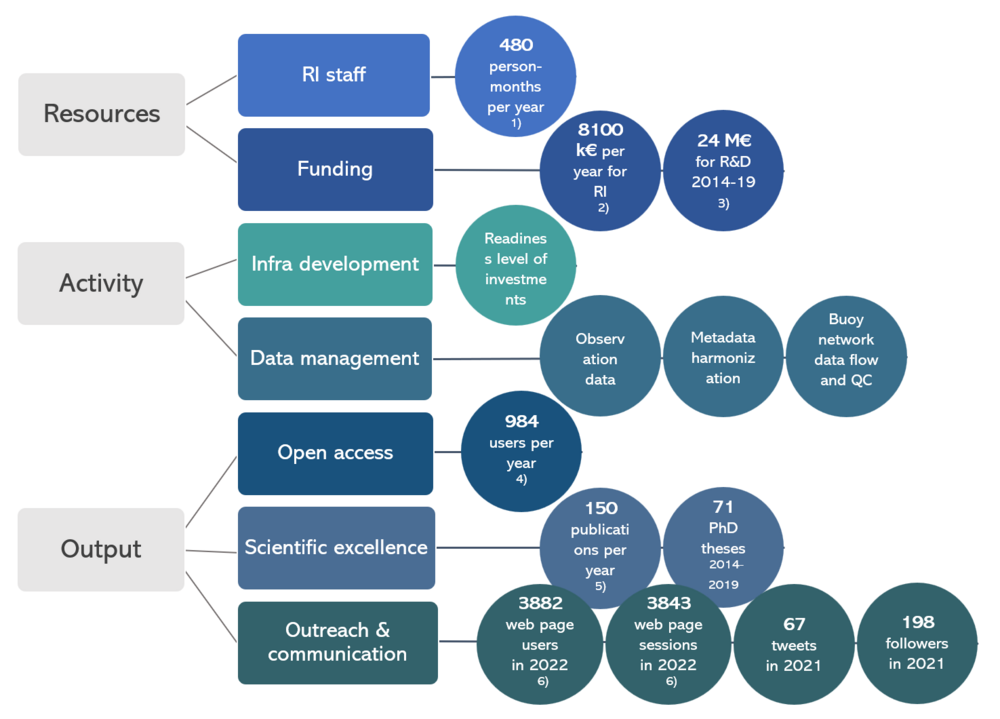
Key Performance Indicators of FINMARI during the building and construction phases (2014-2023). These KPI´s are updated with recent data (- 2024) and further upgraded to best reflect the operational phase as of 2024. 1) per year, mean of 2017-2019; 2) cumulative income/expenditures in 2015-2020 (without R/V Aranda): 40 700 k€ : 8 100 k€/a-1; 3) research funding for projects with 2 or more FINMARI partners in 2014-20; 4) Average of 2017-2019, 440 users in 2020; 5) peer-reviewed scientific publications, mean of 2014-2020; 6) 240 % increase compared to 2021;